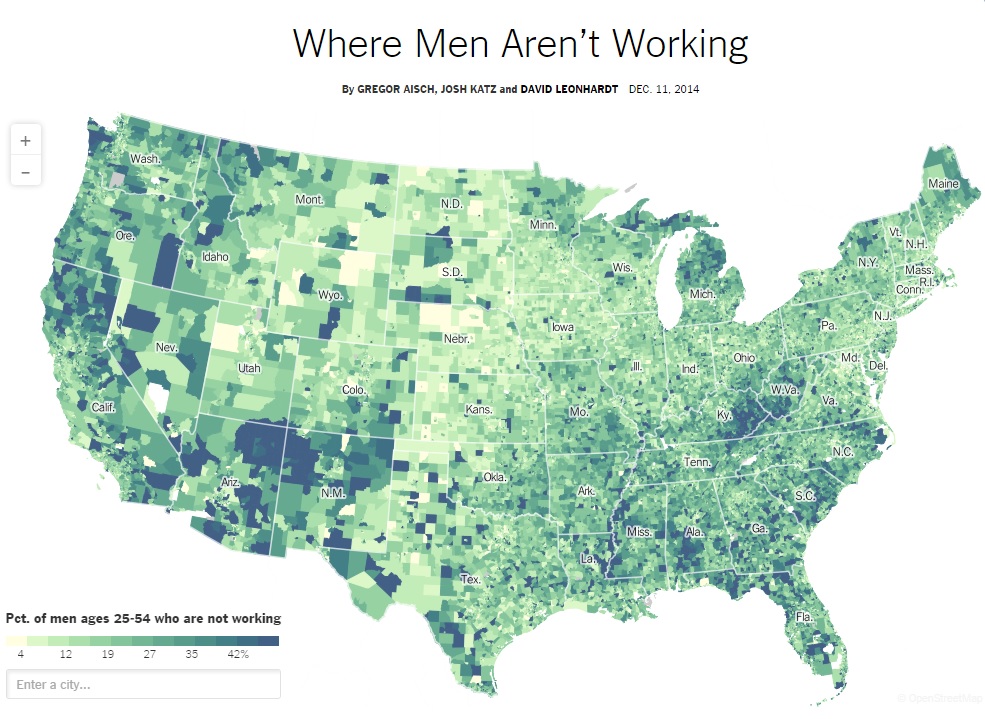
There are still places in the United States where nearly all men in their prime working years have a job. In the affluent sections of Manhattan; in the energy belt that extends down from the Dakotas; in the highly educated suburbs of San Francisco, Denver, Minneapolis, Boston and elsewhere, more than 90 percent of men between the ages of 25 and 54 are working in many neighborhoods. The male employment rates in those areas resemble the nationwide male employment rates in the 1950s and 1960s.
On the whole, however, it’s vastly more common today than it was decades ago for prime-age men not to be working. Across the country, 16 percent of such men are not working, be they officially unemployed or outside of the labor force — disabled, discouraged, retired, in school or taking care of family. That number has more than tripled since 1968.
This map allows you to examine nonemployment rates for prime-age men in every census tract and every county. (Census-tract borders typically follow city or town lines, although they are much finer in large cities.) The data is an average of surveys taken from 2009 to 2013.
You can see the low nonwork rates in those prosperous areas. More strikingly, you can also see sky-high rates across much of Appalachia, the Deep South, northern Michigan, the Southwest and the Northwest. In many towns across Clarke County, Ala.; Iosco County, Mich.; Malheur County, Ore.; and McKinley County, N.M., more than 40 percent of prime-age are not working.
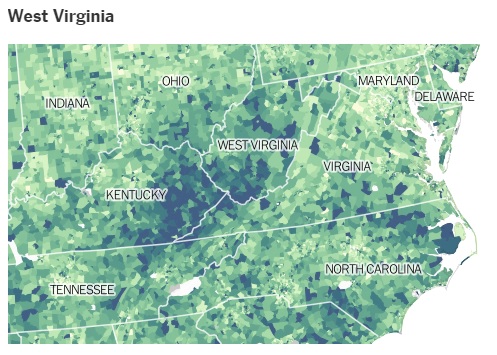
Greater Appalachia — particularly in West Virginia and Kentucky — is on the wrong end of two big trends: It’s coal country, which is suffering amid the concerns about pollution and climate change, as well as the rise of fracking in North Dakota and elsewhere. And Appalachia has low levels of educational attainment at a time when education has become an economic dividing line.In parts of West Virginia and eastern Kentucky — like Magoffin, Breathitt, Leslie and Wyoming Counties — about half the men ages 25 to 54 are not working. In a few counties — including Clay in Kentucky and McDowell in West Virginia — the share exceeds 60 percent. The situation in McDowell seems unremittingly grim: Every census tract has a nonwork rate for prime-age men above 45 percent.Many of them are likely to remain out of work for months or years more, and some of them will never hold a steady job again.
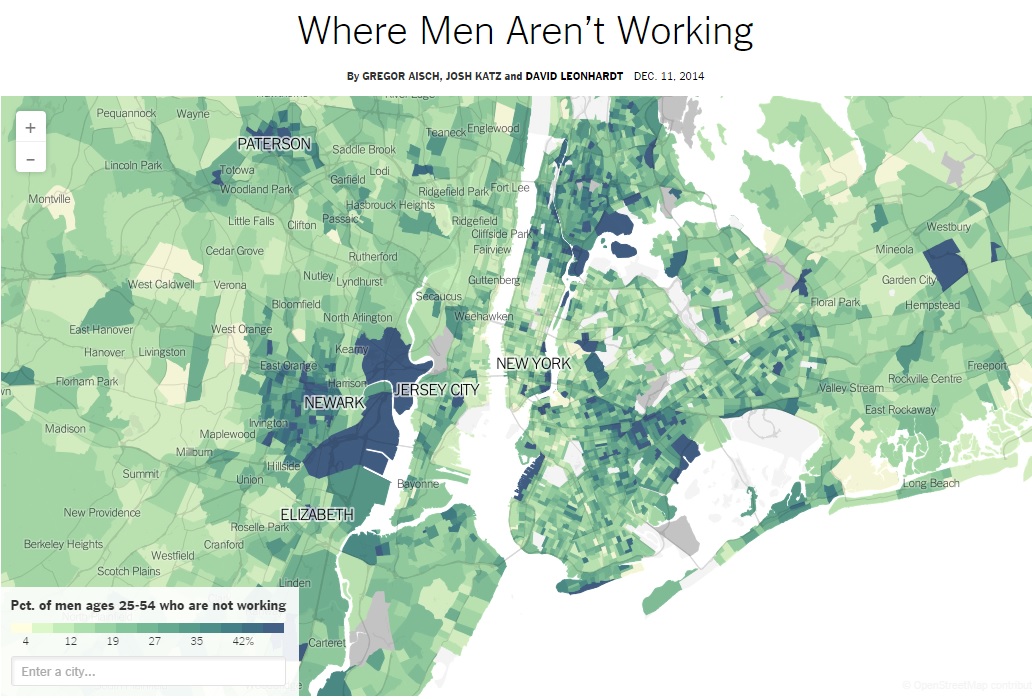
If we shift focus to the Northeast and look at New York, notice how in the five boroughs, the percentage of men who are not working ranges from 17 percent in Queens to 28 percent in the Bronx. A few blocks near the Metropolitan Museum of Art on the Upper East Side of Manhattan had rates around 3 percent. Rates are as high as 100 percent in some census tracts, like the one around Rikers Island, that include jails. (The government counts people in jail in two ways in two different surveys. They are not included in the Current Population Survey, which is used to compute the unemployment rate. But they are counted as being outside of the labor force in these maps, which are based on the American Community Survey.)
Sources:
The full text for this article can be accessed at New York Times Interactive. Last access Feb 2015. Downloaded from http://www.nytimes.com/interactive/2014/12/12/upshot/where-men-arent-working-map.html
Discussion Questions:
What do the men in your family do for work? Are they employed in a professional or semi-professional capacity or do they not work at all?
What social factors do you believe had the greatest influence on their choice (or lack of choice) of occupation?
If you grew up with a father or father figure in your household, did that person ever lose their job? If so, can you describe the impact on your family?
How might have the career choices of the men in your life impacted your decisions about what is possible and desirable for you, in terms of your own potential career trajectory?